BODE DIAGRAM:
The Bode plot is the Gain [dB] and Phase [Deg] of the open loop transfer function of the system plotted against a Log10 scale for w (rad/s).
The gain and phase are calculated by substituting jw for s in the open loop Laplace transfer function of the system. Then calculating the magnitude and phase contribution of each term in the derived expression.
It is very useful to convert the transfer function to the ratio of factors of the numerator and denominator polynomials:
Example:
Let G(s) = 2 (1 + 2s) / (s + 0.3s2)
Put G(s) in Factor form G(s) = 2 (1 + 2s) / s( 1 + 0.3s)
G(jw) = 2 (1 + 2jw)/ jw( 1 + 0.3jw)
Gain is 20*Log10(G(jw)) = 20*Log10(|G(jw)|)
|G(jw)| = 2*(1 + (2w)2)1/2 / w*(1 + (0.3w)2)1/2
Gain in dB is 20*Log10(|G(jw)|)
Gain(dB) = 20*Log10( 2*(1 + (1w)2)1/2 / w*(1 + (0.3w)2)1/2 )
The phase of the transfer fuinction is calculated using the following formula:
Phase F(jw) = S(Numerator Phase Contributions) - S(Denominator Phase Contributions)
F(jw) = Tan-1(2w/1) - (Tan-1(w/1) + Tan-1(0.3w/1))
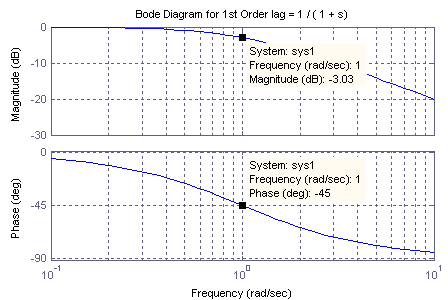
It will be noticed that both the Gain and Phase curves have asymptotes the slopes of these asymptotes depend on how many separate components contribute to the overall Gain and Phase calculation. There start of these asymptotes usually called "breakpoints" can be calculated very easily from the G(jw) representation of the open loop transfer function. See figure below and notice what happens at 1 / t the gain is -3dB and the phase is - 45 degrees.
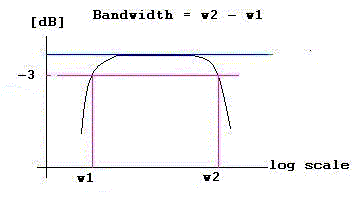
Definition of Bandwidth: Frequency wc is where the normalised gain is equal to -3[dB]

What is the Bandwidth here?

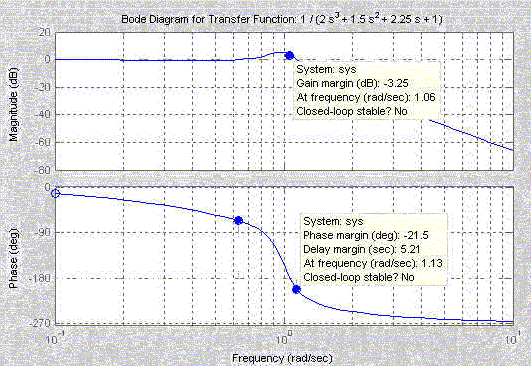
Bode Plot of open loop third order system:

Important parameters in the BODE plot which will discussed later are:
Closed Loop System Stability can be
determined from:
| |||||
Speed of system response to an input can be
determined from:
| |||||
Damping of the System can be determined from:
|